
As the first designer in the organization to contribute production code, I delivered a working website instead of a Figma handoff.
Six beauty trends, one interactive report
UNFURL is Queen’s 2026 Beauty Report, spanning brand registration, six beauty trends, around 60 products, and a personality quiz. I shaped the visual direction, designed the experience, and used AI to build the frontend alongside engineers and a PM.
The registration site was my first production release
Sales needed registration open by the end of May. The visual identity was still undefined, and the frontend engineers were committed to another project.
We initially considered Google Forms, but I proposed building a custom experience with AI. Brands could enter up to five products through a tabbed form on desktop or mobile, unlike previous editions, which supported desktop only.
Using Claude Code, I designed and built the frontend, then shared a working URL for review. Backend engineers built the API and database. The site launched about three weeks after kickoff, and 88 brands registered 155 products through it.
The working prototype went on to become the company’s official staging site, where the team reviewed and tested every release.
六大趨勢
U · N · F · U · R · L
L · LONGEVITY
醫美共生
醫美逐漸日常化,與護膚保養並行存在。療程選擇與診所判斷,也成為新的美麗決策方式,映照出更真實的當代美感。
One flower for each trend
From approval of the main visual to the consumer site’s launch, I had less than two weeks. I developed the visual direction on my own, then designed and implemented pages in parallel as the report took shape.
Working with the editorial team, I translated each of the six trends into a flower with its own material character.
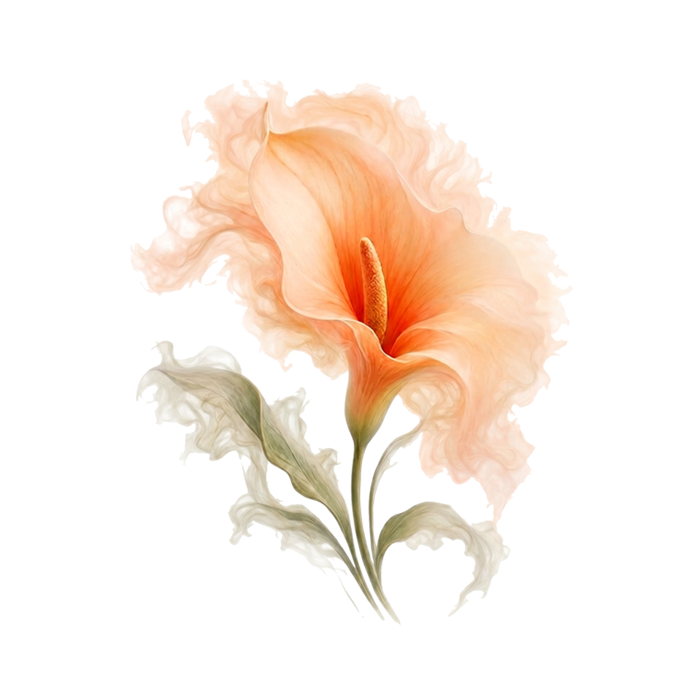
The flowers began as recognizable blooms: chamomile for Unfiltered, a bird of paradise for Unique. Then PR raised an issue I hadn’t considered. Several participating brands are built around signature flowers, so a recognizable bloom could look like a nod to one of them. Each flower had to be invented.
Early direction
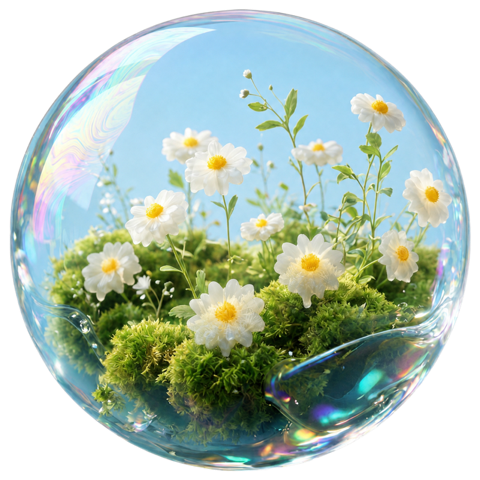
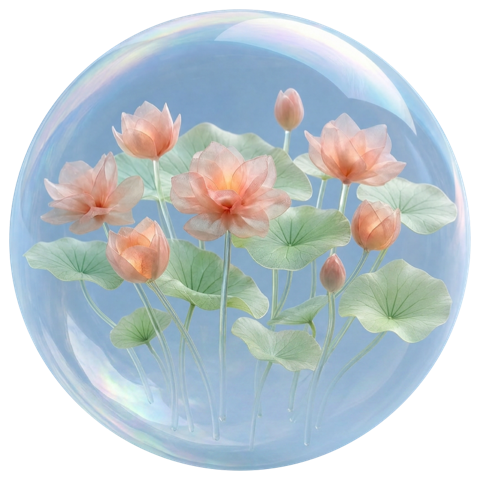
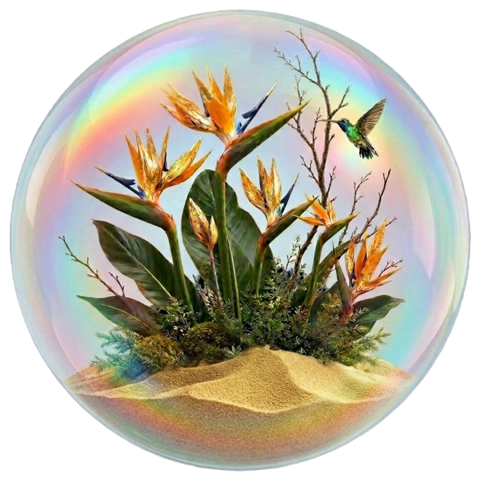
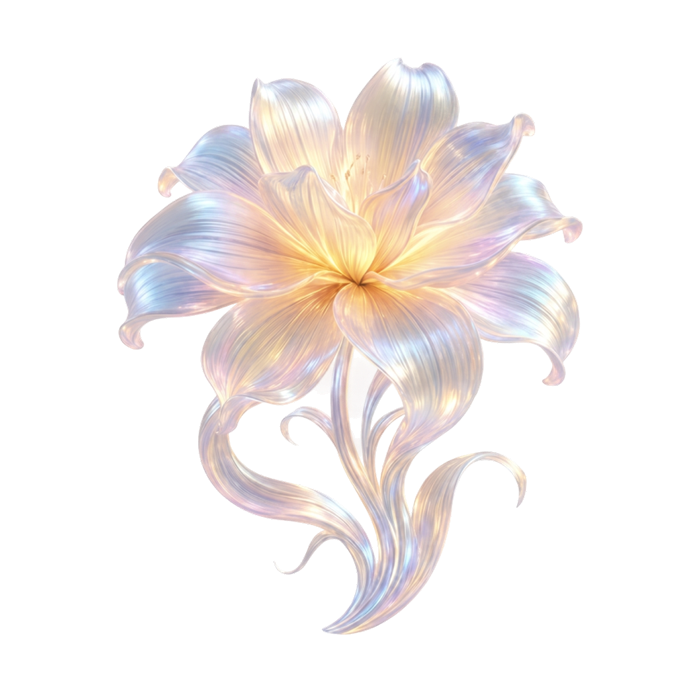
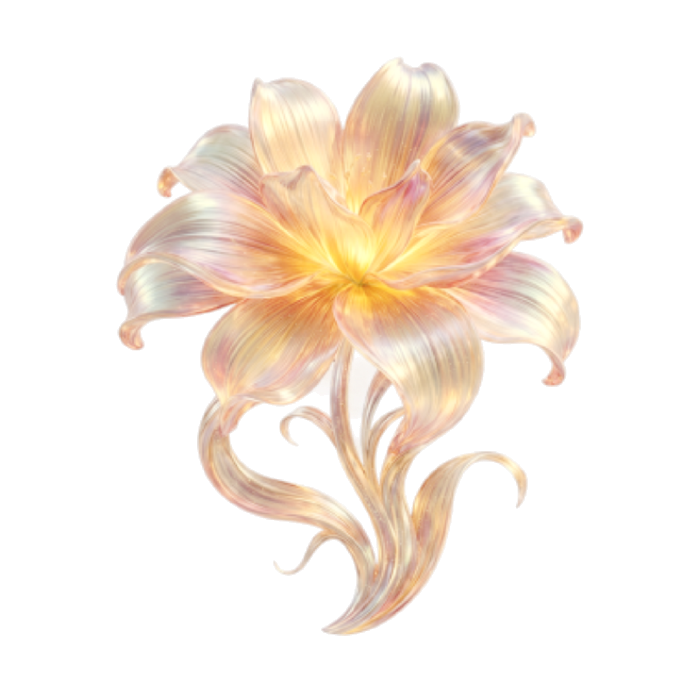
The early versions also had inconsistent backgrounds, which made the flowers feel like a mismatched set. I separated the flowers from the bubbles so I could generate and refine each independently, then bring them together in a cohesive system.
After many rounds of exploration, the editor and I chose six invented flowers. Unfiltered’s dewy look reflects its oral collagen focus, while Unique’s black-and-gold palette signals luxury.
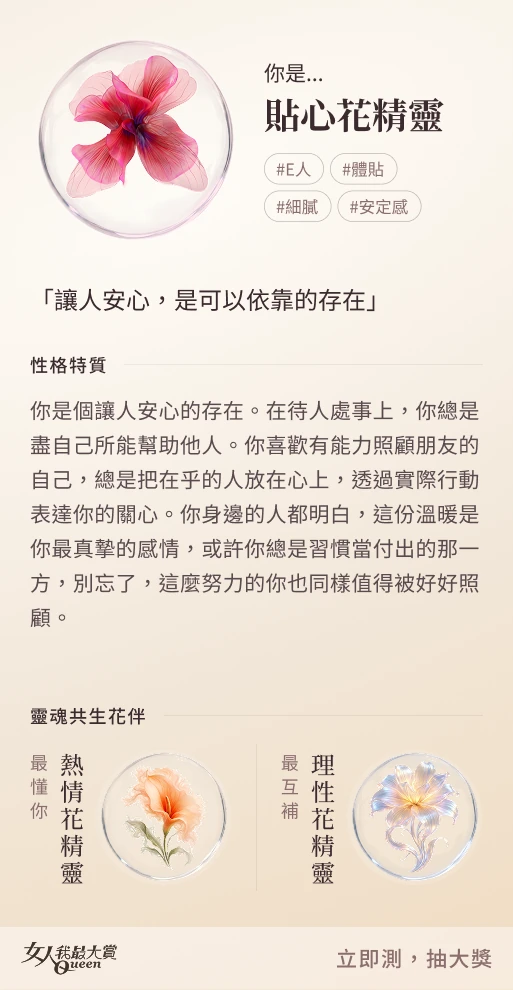
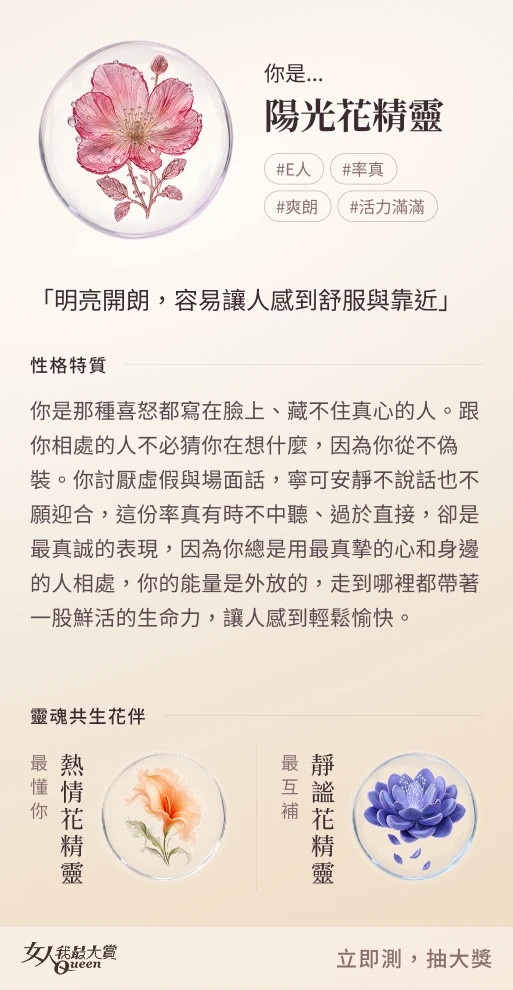
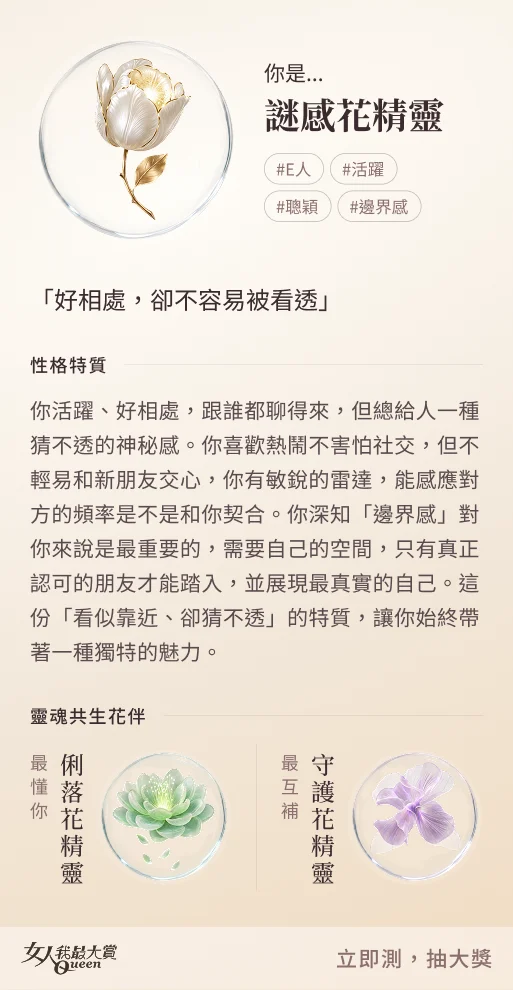
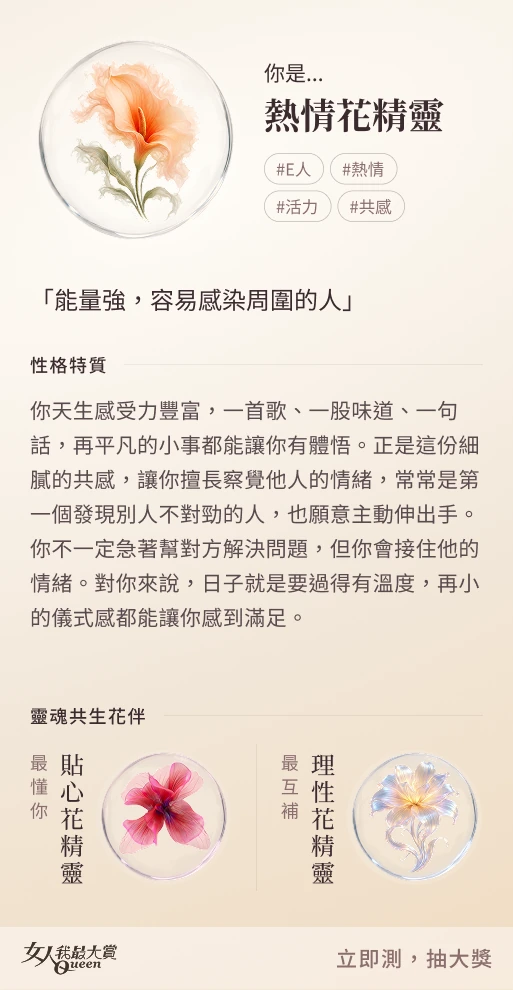
Twelve results from six trends
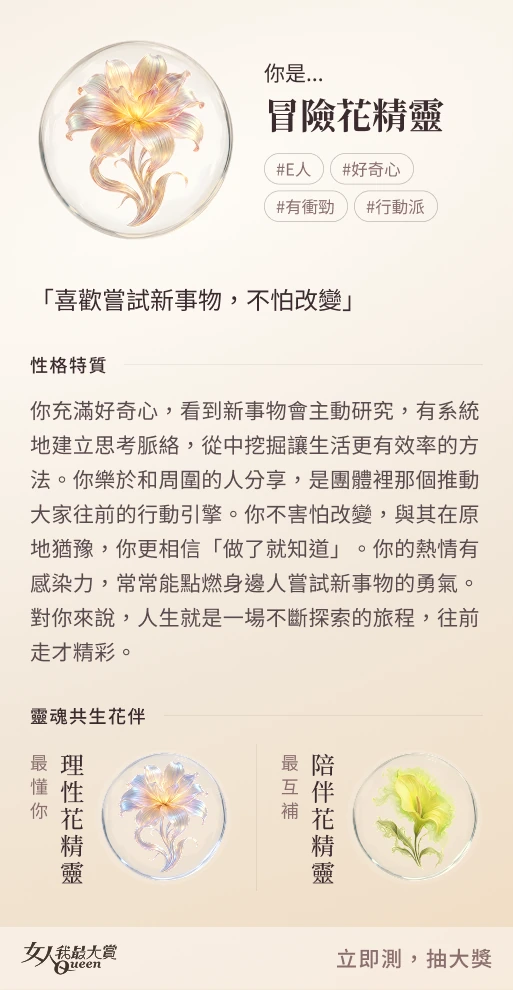
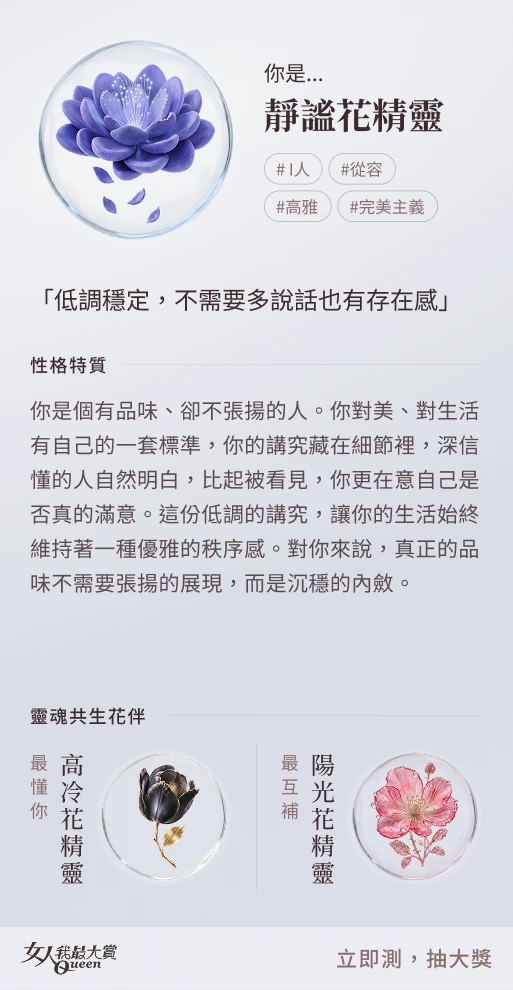
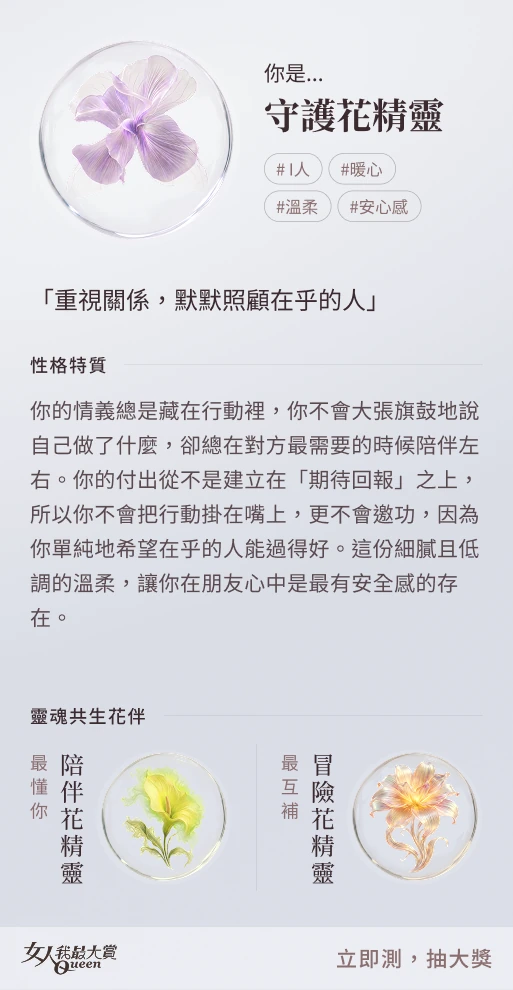
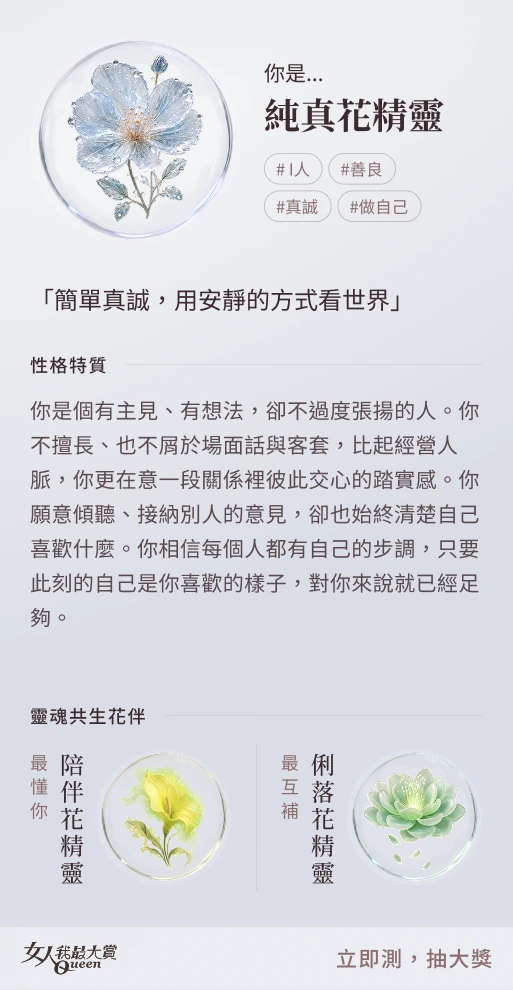
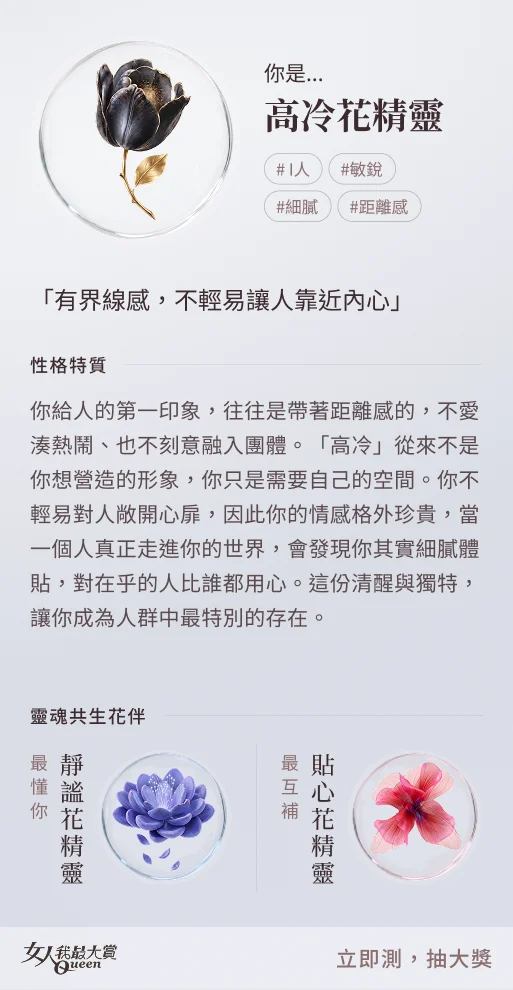
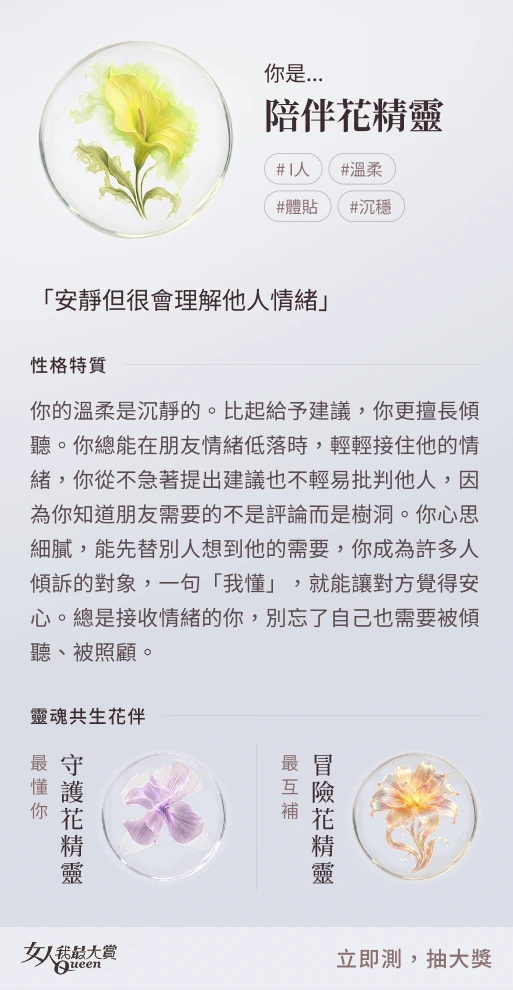
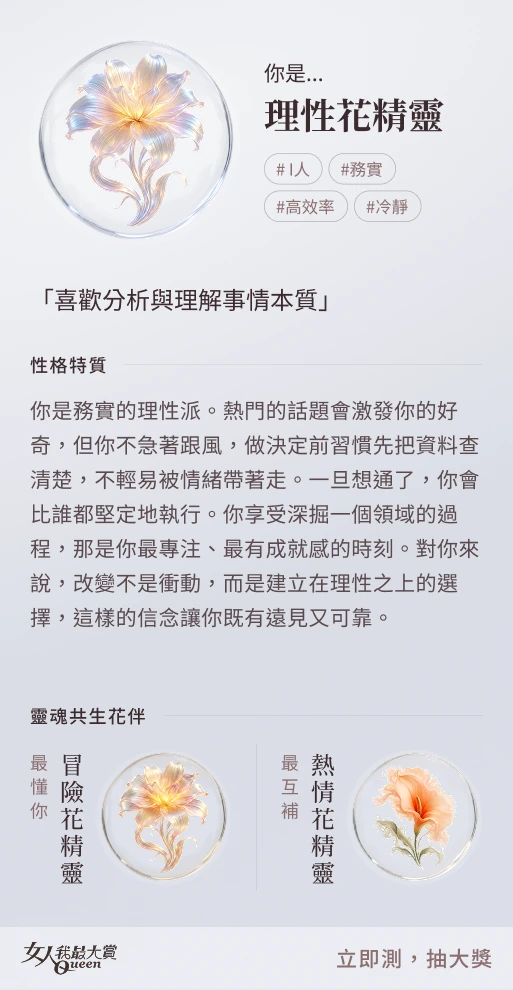
Marketing asked for twelve quiz results, but the report had six trends. Each trend needed an extrovert and an introvert flower: related enough to share a trend, different enough to tell apart at a glance.
The data team defined the questions and scoring. I designed the quiz experience and built its frontend.
Same flower, two temperaments
My first idea was day and night: bright cards for extroverts, dark ones for introverts. My manager wasn’t convinced, so it never went further. Changing the bubble’s shape was quicker to test, and a rough pass showed the problem right away: side by side, the pairs still read as the same result.
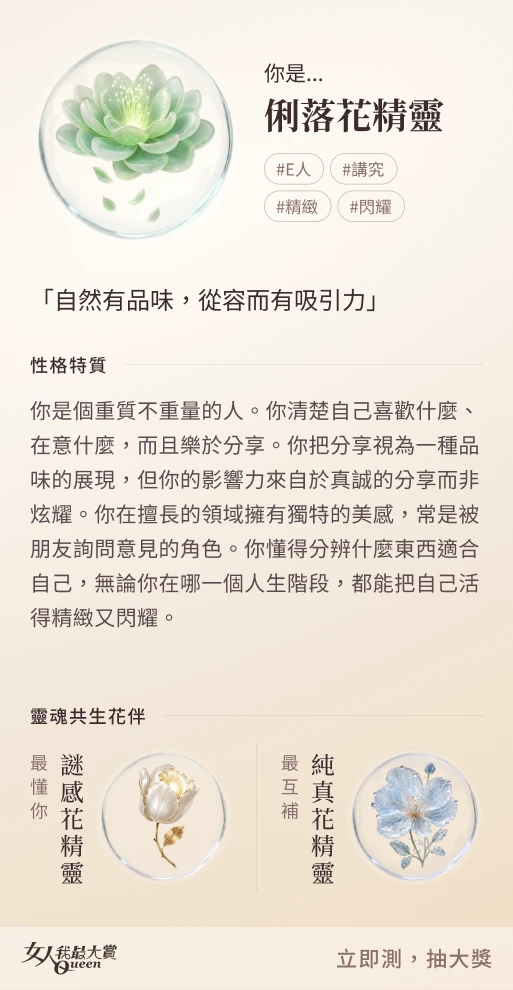
Color made the difference. Each flower got a warm version for extroverts and a cool one for introverts, so every result felt personal while staying tied to its trend.
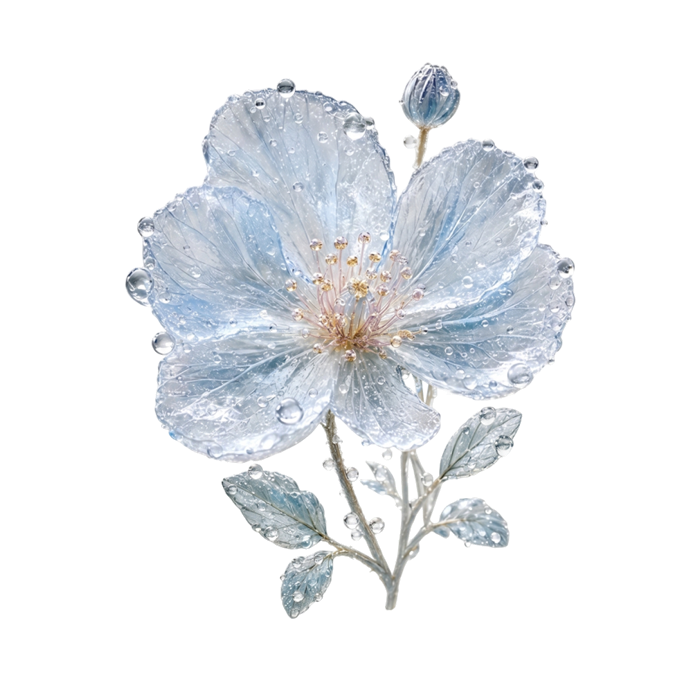
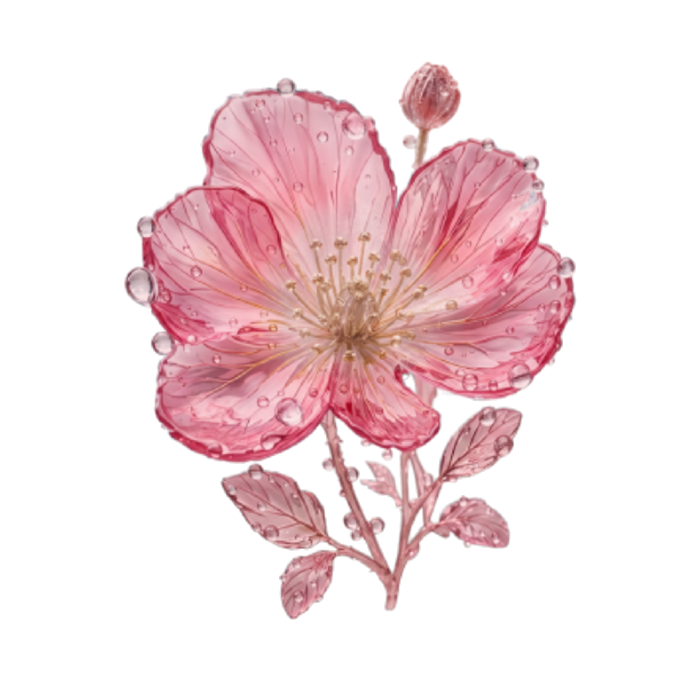
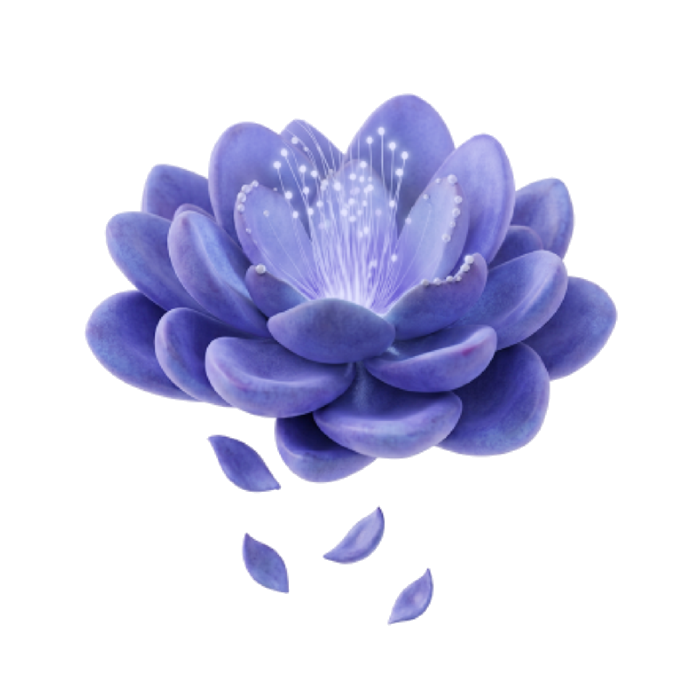
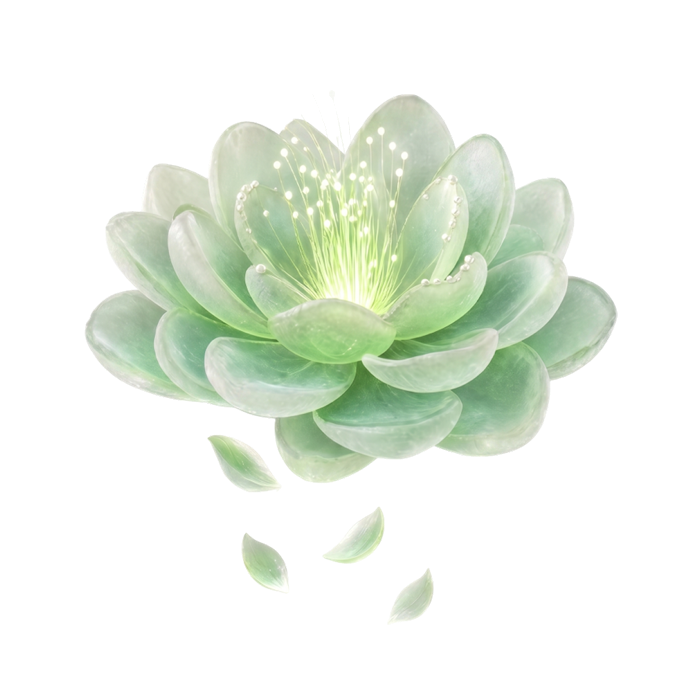
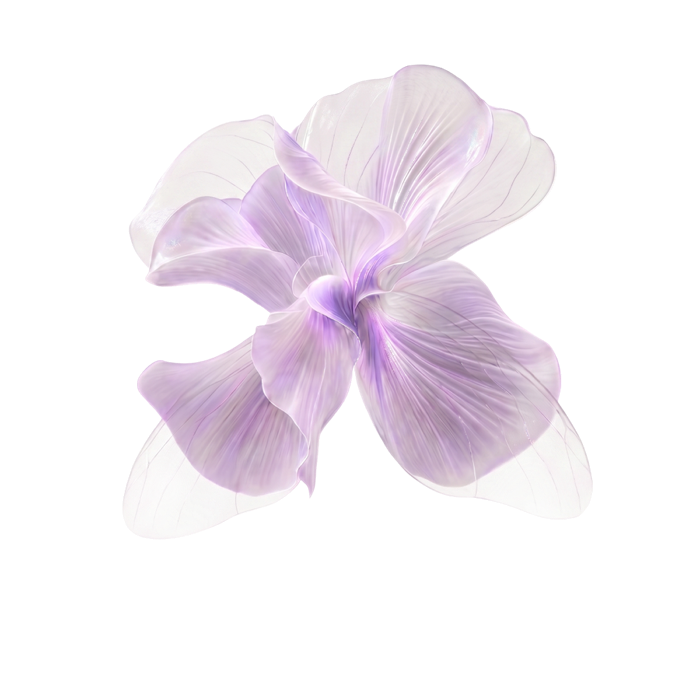
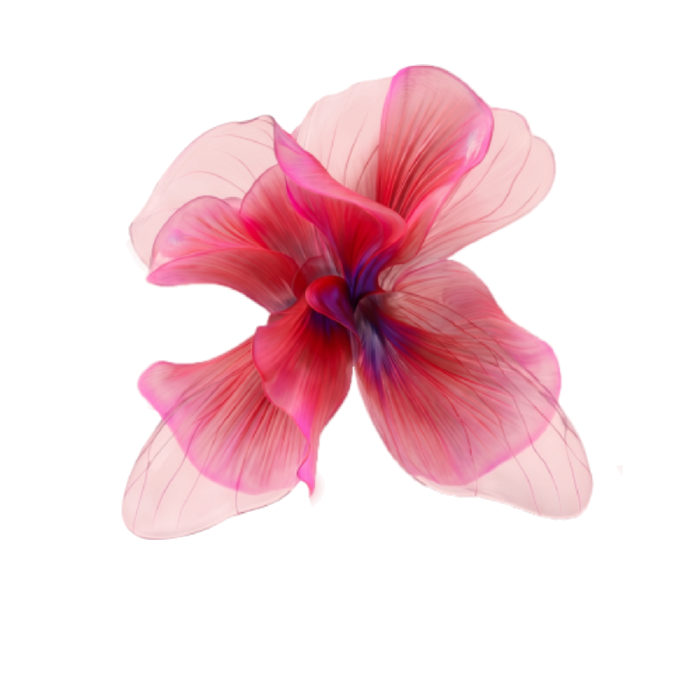
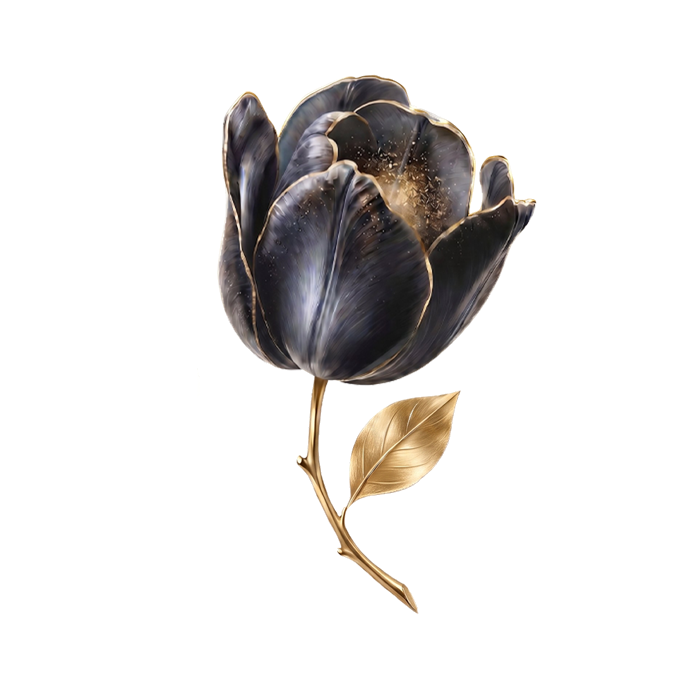
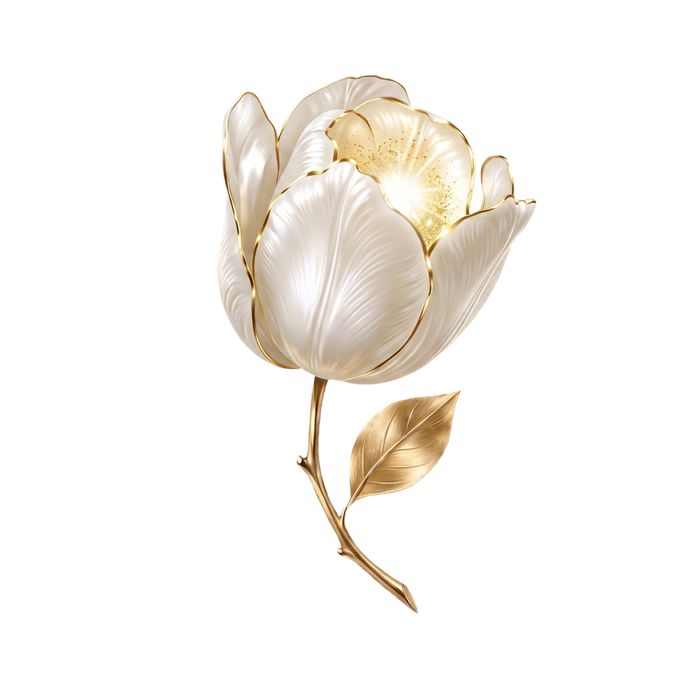
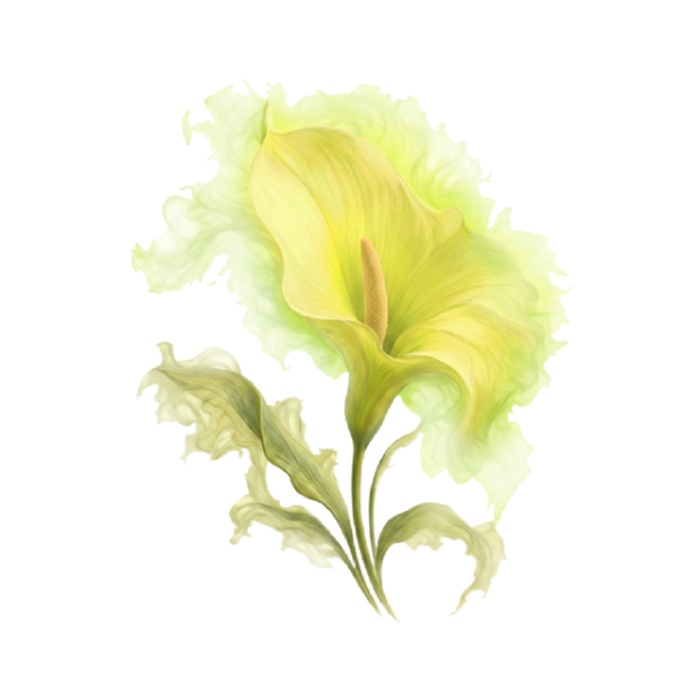
I laid out all twelve result cards in code, then brought them into Figma and adjusted each one by hand.
A new format, live in weeks
As the first edition in this format, these numbers set the baseline for future reports.
88
Brands registered through the site
155
Products submitted for the report
105,412
Active users across the campaign website
July–September 2026
94.9%
Of users who reached question 1 also reached question 6
August 10–September 30, 2026
Next: connecting the quiz to the report
Once visitors started, almost everyone finished: 94.9% reached the last question. The bigger opportunity was earlier. Only 19.5% of quiz-page visitors clicked “Start,” and results didn’t lead back to the trend articles. Next, I’d test what gets more visitors to begin, and let each result open its trend’s article and products.